For her environmental observation and informatics program leadership project, Sharanya Madhavan worked with Greenlink Analytics, a clean energy technology and consulting company that specializes in using data science to help decision makers achieve urban sustainability goals, map equity-related issues, and transition to a clean energy grid.
 One of their initiatives is GEM, a GIS-based platform that maps 20 equity indicators, including energy burden, asthma rates, and racial demographics, down to the census-tract level to assist cities with combatting equity related issues.
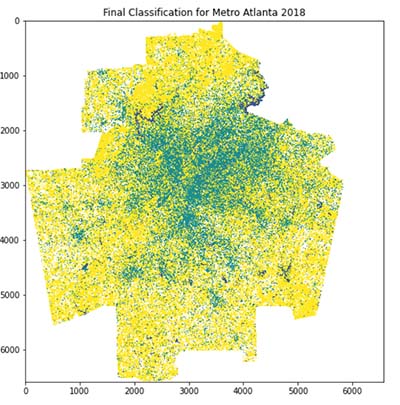
To understand social equity-related issues connected to urban heat, impervious surfaces and urban tree canopy cover need to be mapped on a census-tract level to connect heat equity and other indicators. Madhavan created an automated workflow to process and classify satellite imagery to create a dataset of impervious surface and urban canopy cover for each urban census tract.
The workflow allows Greenlink Analytics to scale up and apply the same process to any urban area and integrate the outputs with their other equity indicators.
Project Details
Full Title
Mapping impervious surface and urban tree canopy cover in Atlanta, GA
Deliverables
- Dataset of impervious surface and urban canopy cover for each census tract in Atlanta
- Land cover map of impervious surface and urban canopy cover for Atlanta
- Python script to automate classification of impervious surface and urban canopy cover
Environmental Topic
Urban
Partner Organization
![]()
Skills Used in This Project
![]()
Remote sensing analysis
![]()
Programming
Get to Know Sharanya Madhavan
 Undergraduate Major
 Undergraduate Major
Industrial engineering
Current Job
Data scientist, Greenlink Analytics
How did the EOI program prepare you for this project?
“A huge lesson that I have learned through this project and the EOI program is that just knowing how to code does not necessarily get you very far. Going into the geospatial data science field, it is extremely important to have a good understanding of the conservation topic you are trying to get data for along with having a strong understanding of the satellite imagery being used. “