
This page is archived and kept only for reference. The information may be outdated or inaccurate, and the content may not meet current accessibility standards. If you need assistance, please email us at communications@nelson.wisc.edu.
The field of earth observation is data-intensive. Hundreds of terabytes of data are generated each day. While computer science and engineering have always been an integral part of earth observation, the demand for generating actionable insights from the huge volumes of data has made programming skills more useful.
If you have programming skills, an eye for pretty data, and a desire to make a difference, the field of earth observation may be a good fit for you. Our environmental observation and informatics MS program is aimed at the intersection of the geospatial and environmental fields.
What is Earth Observation Data?
Earth observation data are created from remote sensors (think satellites, airplanes, and unmanned aerial vehicles, also known as UAVs) that measure the surface of the earth. The sensors and data types vary widely, but all data has a geographic location as an x and y coordinate and a value for that location. If you have used the satellite image background on your phone mapping app, you have used earth observation data.
Why is Programming Useful?
Huge Volumes of Data
Simply stated, there is so much data from multiple data sources. For example, the opening of the Landsat archive in 2008 made data free and open to the public. Tools like the USGS Earth Explorer allow anybody to access data from the archive, but it is still a manual process. Once you get the data, you could use a proprietary software program such as ENVI to analyze the data.
Enter online cloud platforms that archive and distribute massive datasets (such as Google’s Earth Engine data catalog or Microsoft’s Planetary computer). Now the Landsat archive, in addition to thousands of other datasets, is available at the tip of your fingers. All you have to do is know how to write code and use APIs (application programming interfaces). The growth of easy access to loads of data increases the expectation to access all the data quickly and in an automated way.
Demand for Fast Insights
How many buildings were damaged by the hurricane? What are the carbon impacts of national policies on deforestation? Where are the wildfires going to expand to next? Earth observation data has always been useful for providing useful information for society. But now we want that information quickly and analyzed in a robust way so we can make sense of it. Individuals, and in most cases teams, who have access to the data, can analyze it quickly, and provide information in meaningful ways, can harness powerful information.
Top Programming Languages
Python
Python is a popular language in many fields due to its simple syntax, flexibility, readability, and integration with other languages and tools. These reasons helped a large interdisciplinary community gather and build exceptionally useful libraries for data science, geospatial engineering, and machine learning. Python libraries like “arcpy,” “geopandas,” and GDAL/OGR let individuals work with the unique features and attributes of geospatial data. Libraries like “scikit-learn,” “pytorch,” “rapids.ai” and “tensorflow” are the backbone of most recent advancements in earth science applications.
With Python libraries one can quickly identify areas affected by wildfire, classify land use, or determine ecosystem health with very little code — and it’s fast. It can take less than a few hours to run algorithms for areas as big as an entire state.
Integration of earth science data with data science libraries like “numpy,” and “scikit-learn,” and “matplotlib” supports creating powerful workflows for analyzing and visualizing spatial data without a need for licensed software. In addition, Python APIs for Google Earth Engine are getting some needed attention, allowing individuals to access and analyze images in the cloud without the JavaScript interface (though keep reading because it is useful).
Organizations like Microsoft, NASA and the Ecological Society of America (ESA) are also providing APIs for accessing cool new datasets not yet available on Google Earth Engine, like NASA hyperspectral satellite data.
JavaScript
JavaScript is most often used as a client-side scripting language for web development and has been useful in geospatial data analysis. With the advent of libraries like “Leaflet” and “Mapbox,” JavaScript is increasingly used to create interactive, location-based web applications and maps.
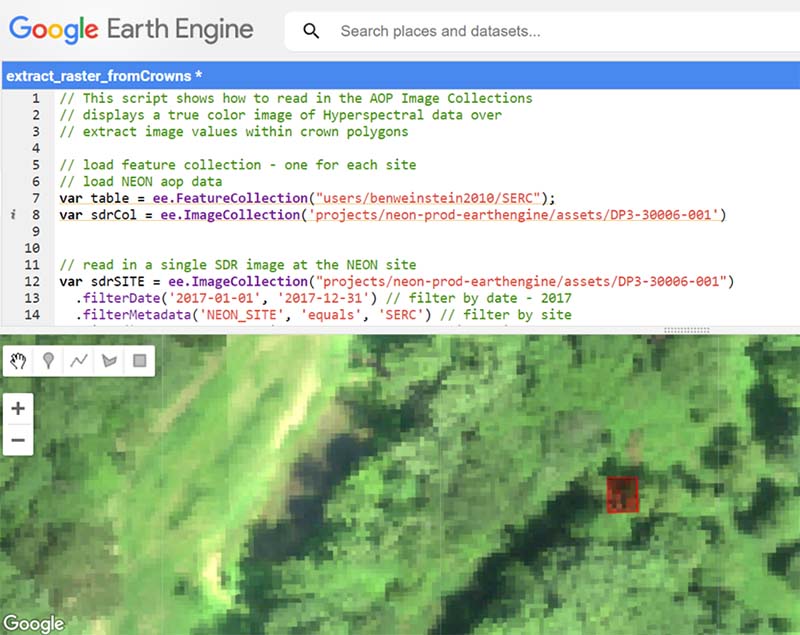
The growth of JavaScript in earth observation has been driven by online data platforms, such as Google Earth Engine (GEE). Google Earth engine is Google’s cloud-based processing platform, with most people using the JavaScript interface. Because so many remote sensing data sources are now available on the cloud, having JavaScript skills to process cloud-based data is valuable.
The demand for using cloud-based processing platforms has resulted in new GEE tools and learning opportunities. The publication of the open access book Cloud-Based Remote Sensing with Google Earth Engine: Fundamentals and Applications is an easy entry to earth observation data, programming, and a variety of cool applications.
R
R is another fun language in earth observation because of its power to analyze and visualize data. Since R is commonly taught in statistics courses, has simple syntax, and an easy-to-use interface (R Studio), it is a common language in many fields of study. Packages like “dplyr” allow the individual to manipulate data easily and efficiently — making any novice programmer feel empowered. Creating simple, yet beautiful, graphics with “ggplot2” is incredibly satisfying for anyone who wants a visual output of their work.
While R may lag behind some of the advanced Python libraries for spatial data analysis, packages like “sf” and “terra” allow users to import, manipulate, and plot geospatial data. Terra is efficient in extracting data and calculating statistics from rasters to polygons, often making its use the faster alternative to its Python counterparts. Combined with R’s powerful packages to manage and visualize data, users can do advanced geospatial statistics and visualizations.
About the Authors
Sarah Graves and Sergio Marconi are contributors in the IDTReeS research group, an interdisciplinary team of faculty and students based at the University of Florida, with postdocs and researchers based across the U.S. The group’s combined expertise is in forest ecology, remote sensing, data science, machine learning, and modeling. They have led workshops in using R to analyze and visualize geospatial data in R, created open access datasets of classified trees, and tools to collect and use ecological data.
Sarah Graves
 As someone who came to remote sensing and programming through ecology, learning programming has been a big challenge for me. I started dabbling in Python and now I’m trying to develop seamless workflows that capitalize on the strengths of Python, JavaScript, and R. I mentor and advise students in the environmental observation and informatics program at the University of Wisconsin–Madison, which includes individuals with different coding backgrounds. Having students with backgrounds in data science or computer science who are not intimidated by programming expands the learning potential of the students in the cohort and post-graduation opportunities.
Sergio Marconi
 I started as a forester who had very little programming skills, but quickly realized that programming skills offer a fundamental toolkit to investigate the world and answer an unquantifiable number of exciting questions about our planet. I now use Python, JavaScript, R and other languages in my work as a remote sensing scientist and geospatial engineer for Terra Global Capital. I help my peers create and monitor projects for carbon pools by building models for mapping land use change for regions potentially affected by forest degradation or deforestation.