
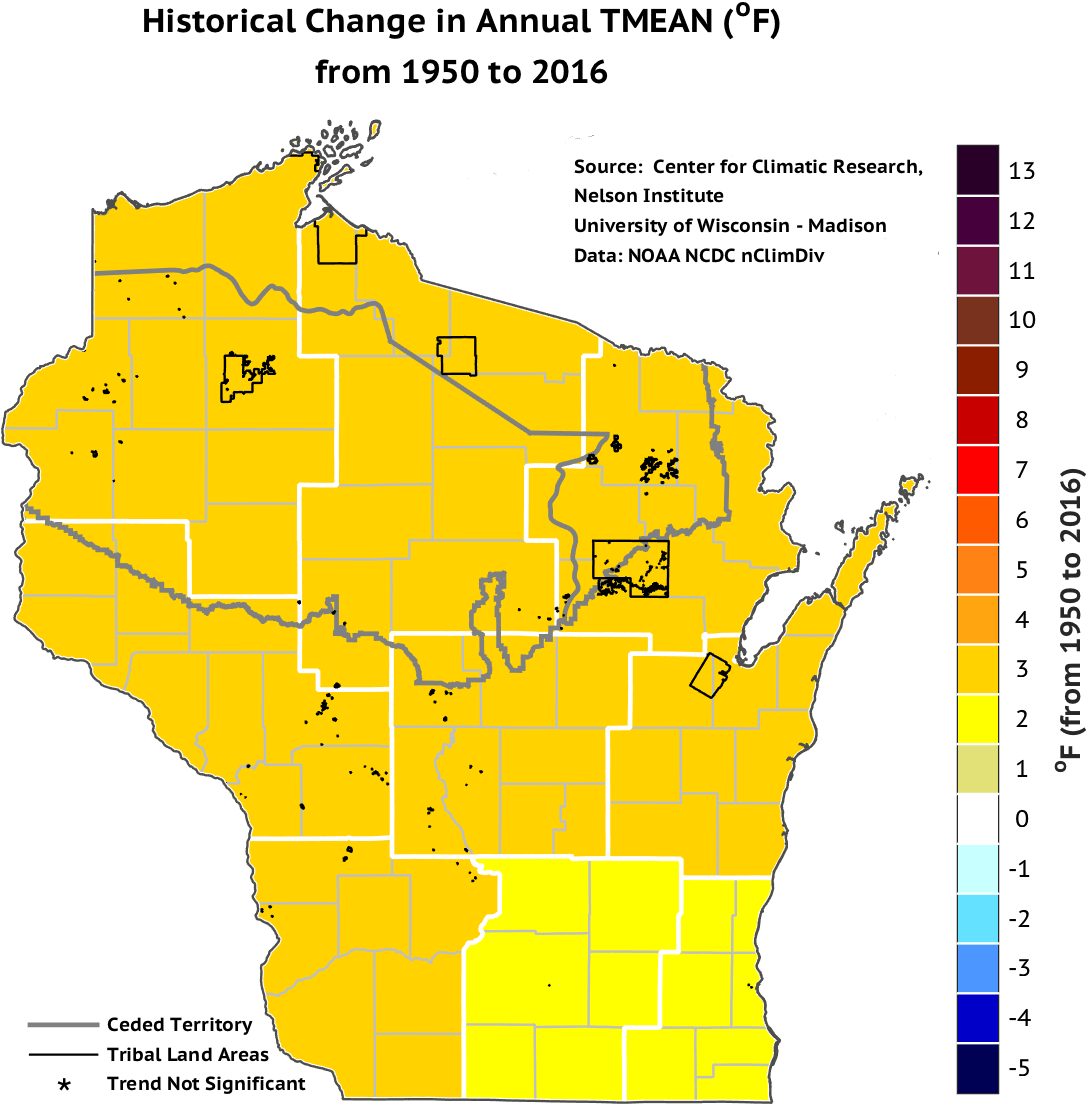
Wisconsin’s climate is changing. A wealth of temperature and precipitation data provide evidence that on average our state has become warmer and wetter over the past 60 years. In particular, Wisconsin has warmed by 2-3°F over the time period 1950-2016. Most of that warming has occurred during the winter months (3-5°F warming) and the least warming during summer (1-2°F). Similar warming trends have been observed in spring (3-4°F warming) and fall (2-3°F warming) over the same time period. The historical change in annual mean temperature is shown below.
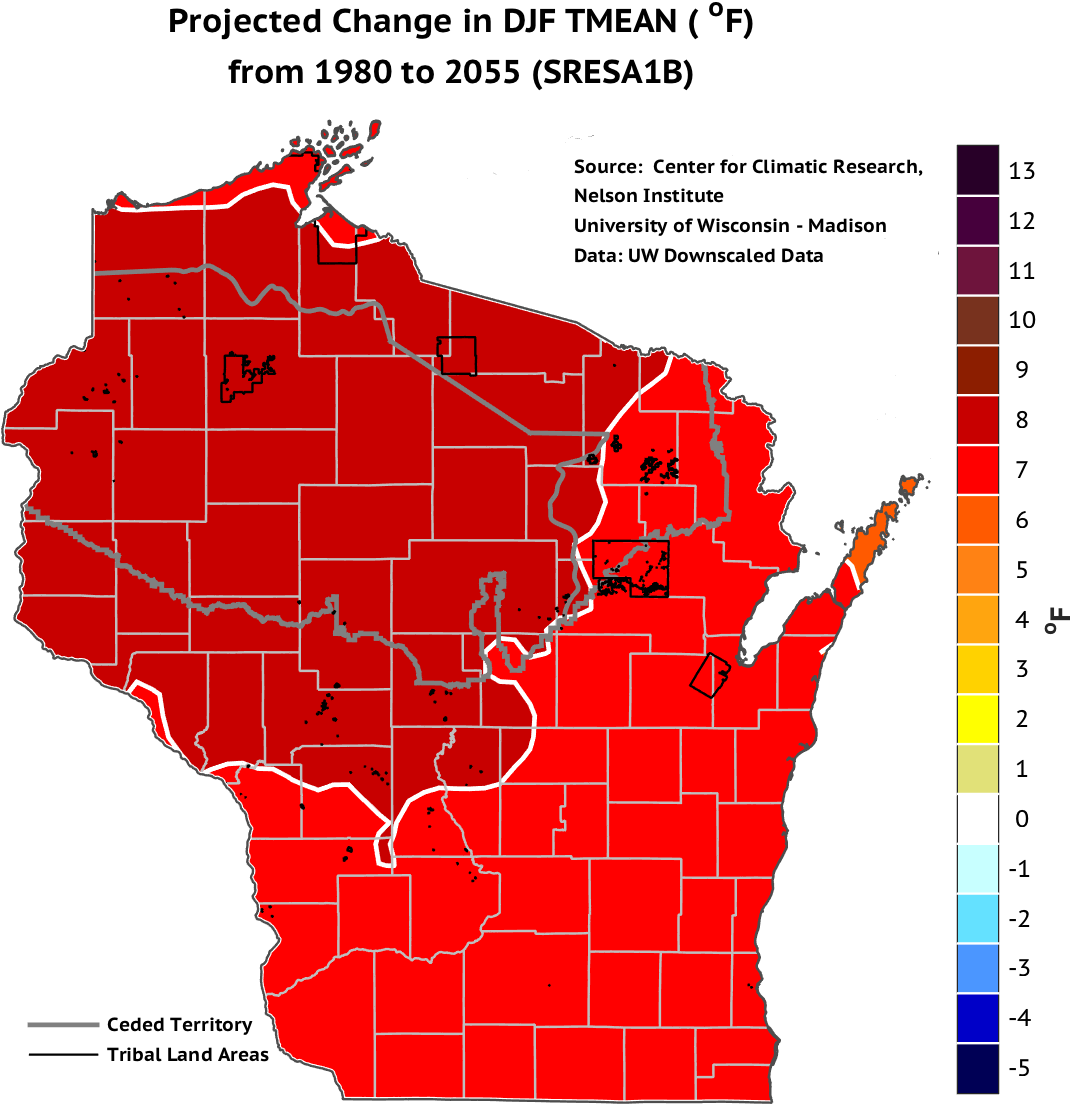
Scientists project that the decades ahead will bring changes in climate much more profound than those already observed; in some cases those changes could occur more rapidly than plant or animal species can adapt. Wisconsin is expected to warm by 3-9°F by the middle of the 21st century (compared to late 20th century conditions). Consistent with the historical trends, nighttime low temperatures are expected to increase more than daytime high temperatures.

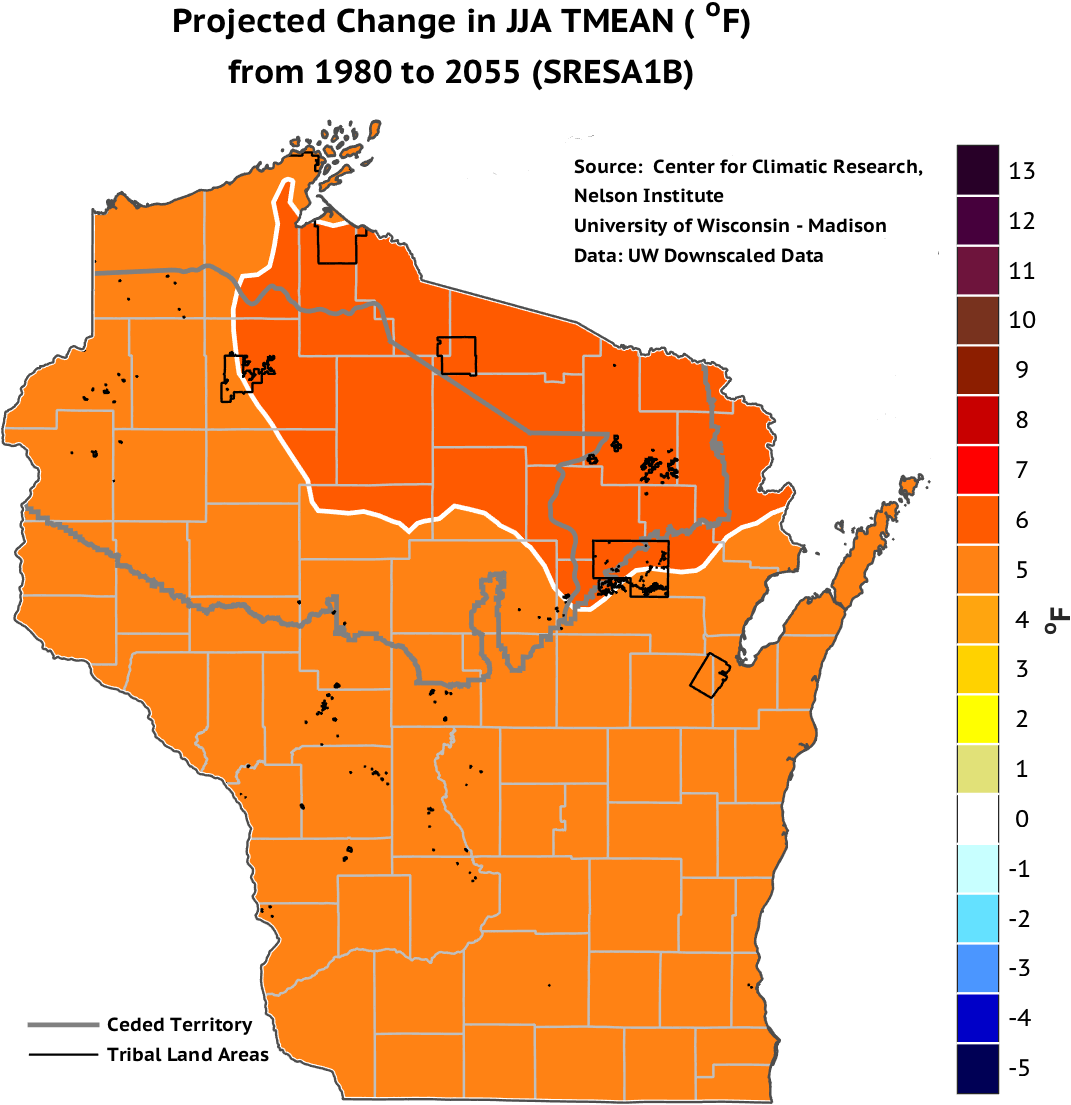
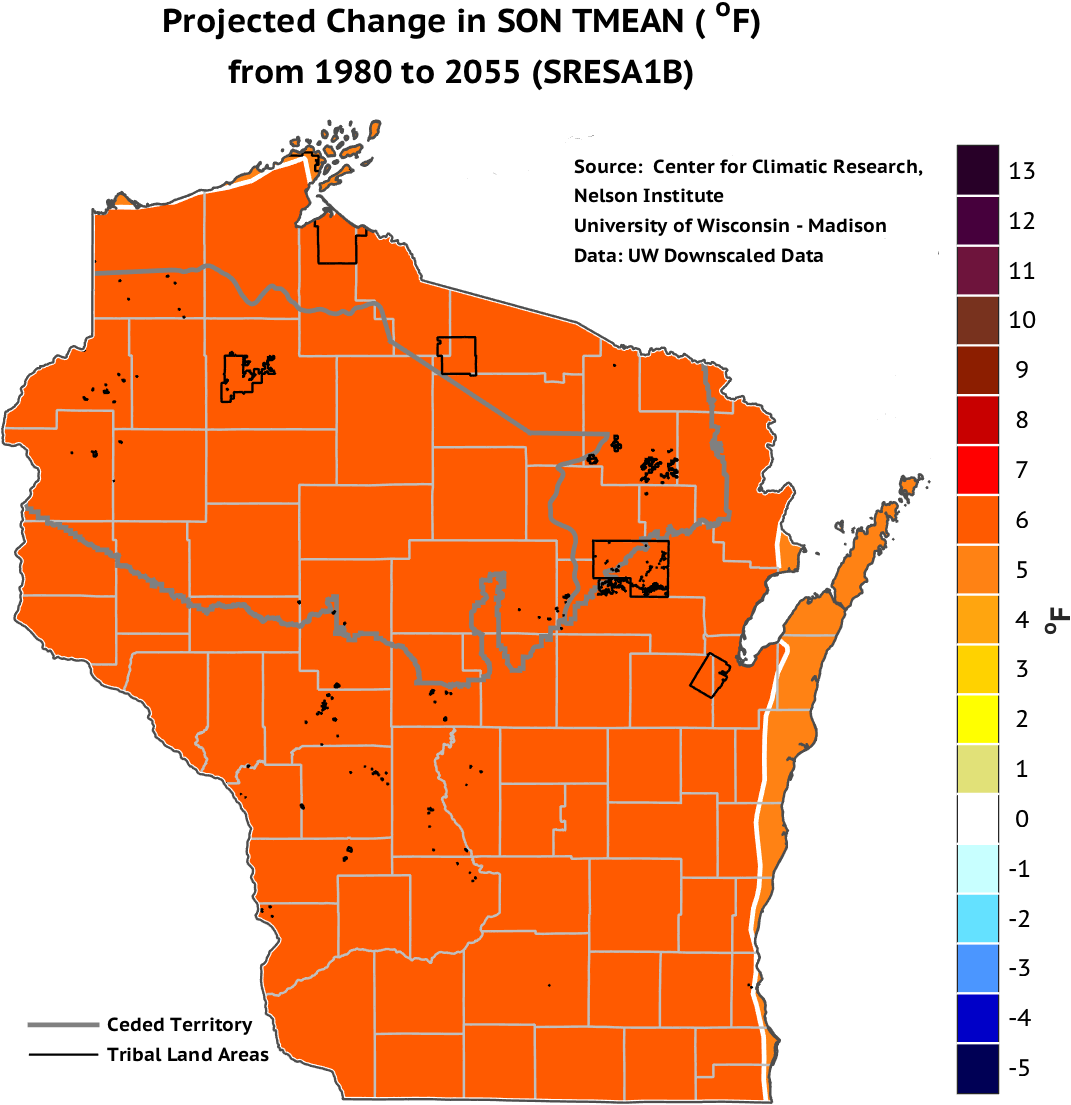
By mid-century, seasonal temperature increases (above current conditions) are projected to be greatest in winter, followed by spring and fall, then by summer. For example, wintertime temperatures are likely to increase by between 4-11°F, while summertime average temperatures are likely to rise about 2-8°F statewide. Further, nighttime low temperatures are expected to warm more than daytime highs for all seasons.
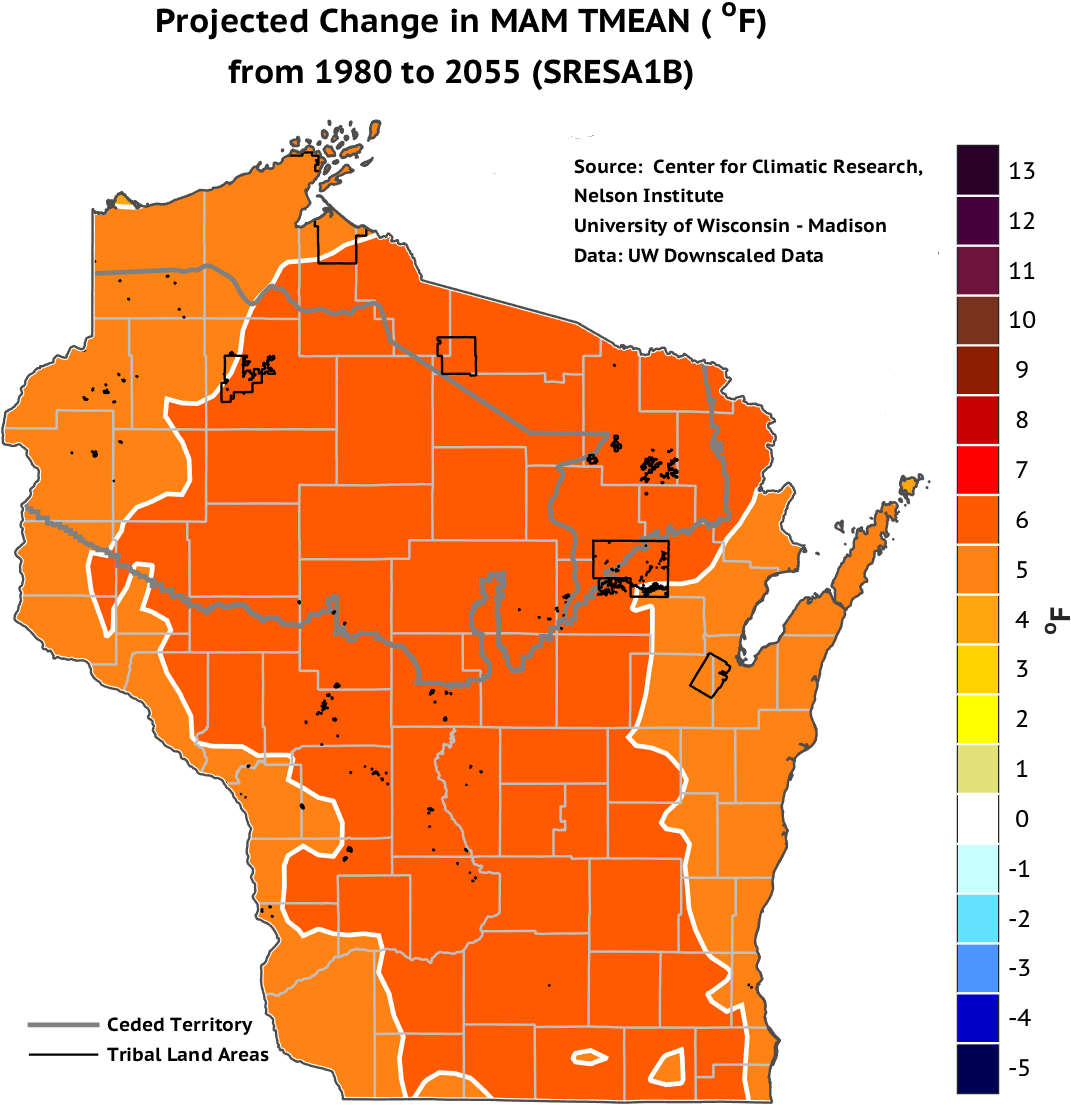
Spring and Fall temperatures are also expected to increase by about 2-9°F. A warmer Spring corresponds to an earlier date of the last frost, while an earlier Fall corresponds to a later first frost of the season. Taken together, this corresponds to a longer growing season.
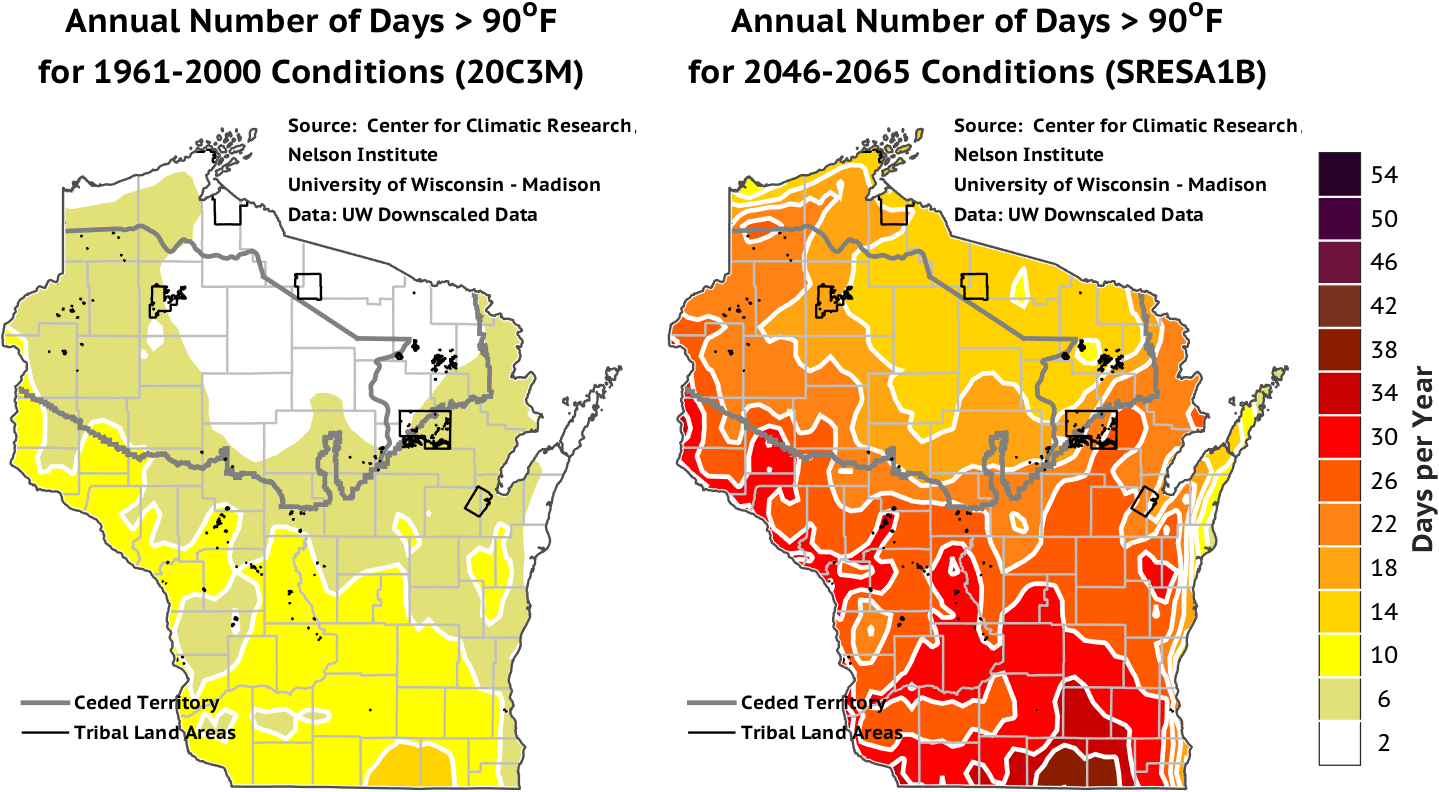
With this warming, the number of days when the high temperature exceeds 90°F is expected to approximately triple across the state. Southern Wisconsin currently experiences about 10 days per year when the temperature climbs above 90°F. Projections show that by mid-century, southern Wisconsin will experience about 30 days per year total when temperatures exceed 90°F. In northern Wisconsin, temperatures currently rarely exceed 90°F (usually around 2-6 days per year). Projections show that by mid-century, northern Wisconsin will experience a total of about 14-20 days per year where temperatures exceed 90°F.
Nighttime low temperatures are also warming, and at a rate slightly faster than daytime high temperatures. Across Wisconsin it has been historically rare to experience nighttime temperatures that remain above 70°F (about 0-5 nights per year). Projections show that by mid-century, southern Wisconsin will experiences about 20 such nights per year; northern Wisconsin will experience around 5-10 nights per year. This introduces the possibility of “no analog” climatic events: events that are extremely rare or non-existent in the historical record may be common by mid-century, and routine by the late 21st century.

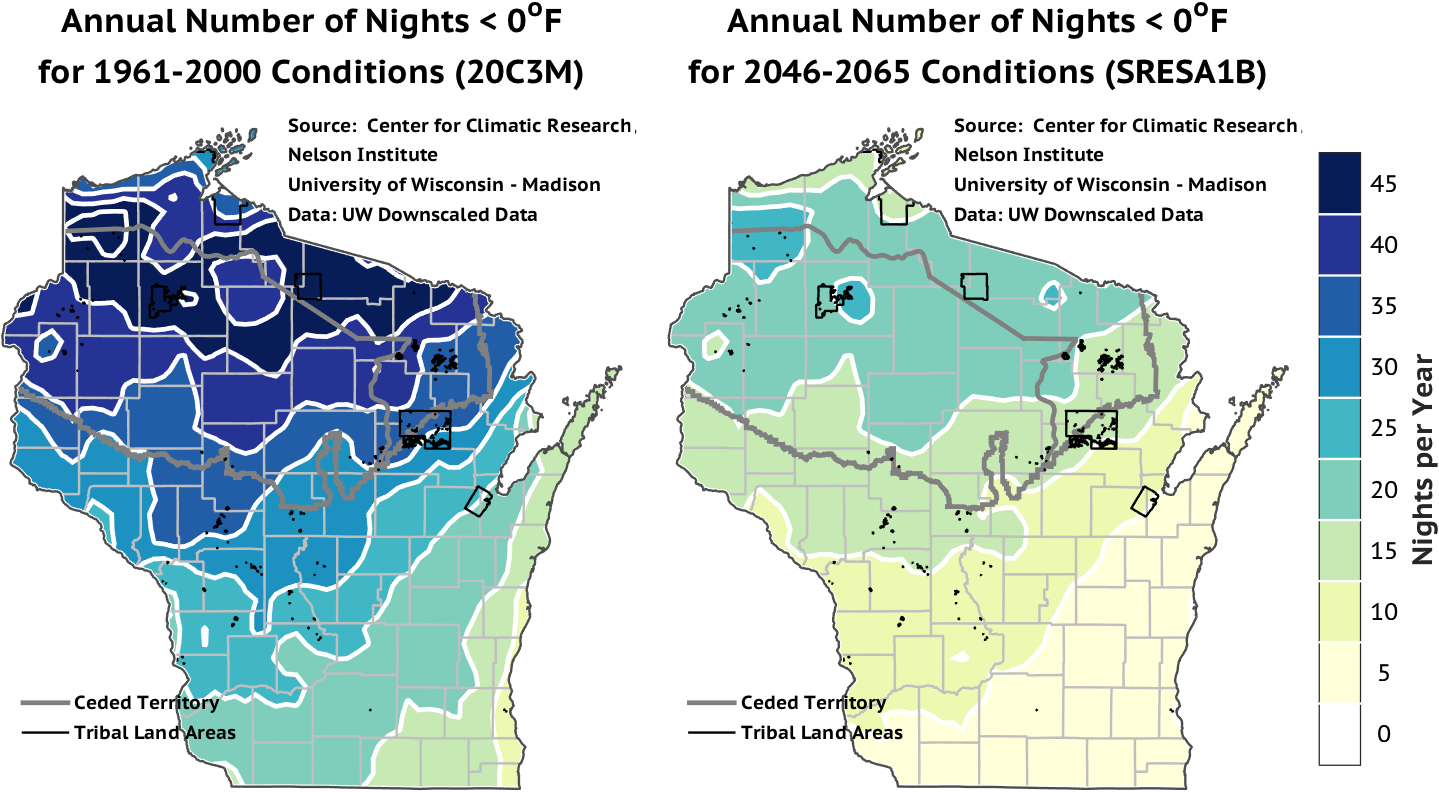
Consistent with these warming trends, the number of winter nights that experience nighttime low temperatures below 0°F is projected to decrease significantly across the state by mid-century. A decline of about three weeks of these cold nights is expected in northern Wisconsin, and about two fewer weeks in the southern Wisconsin.
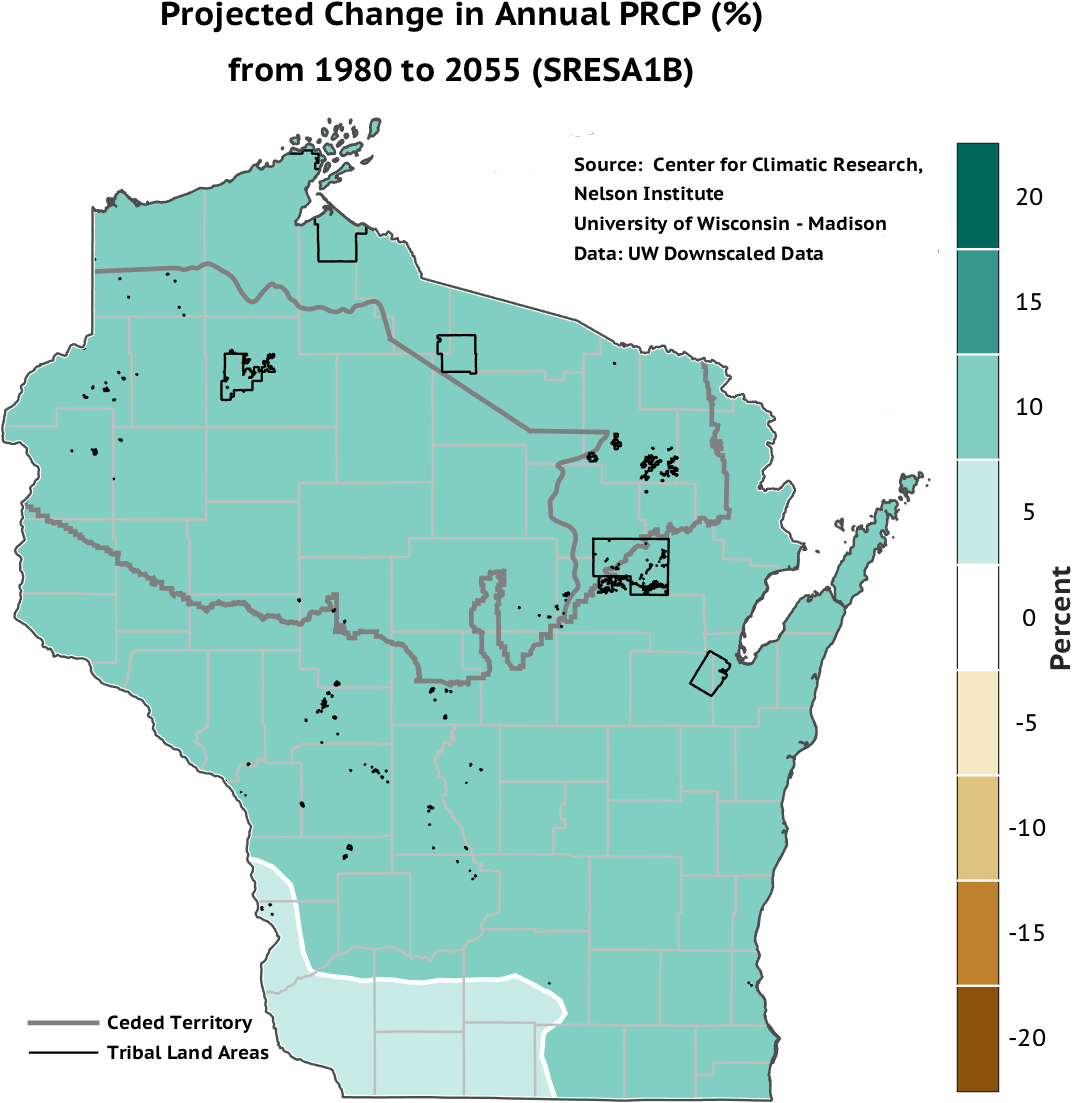
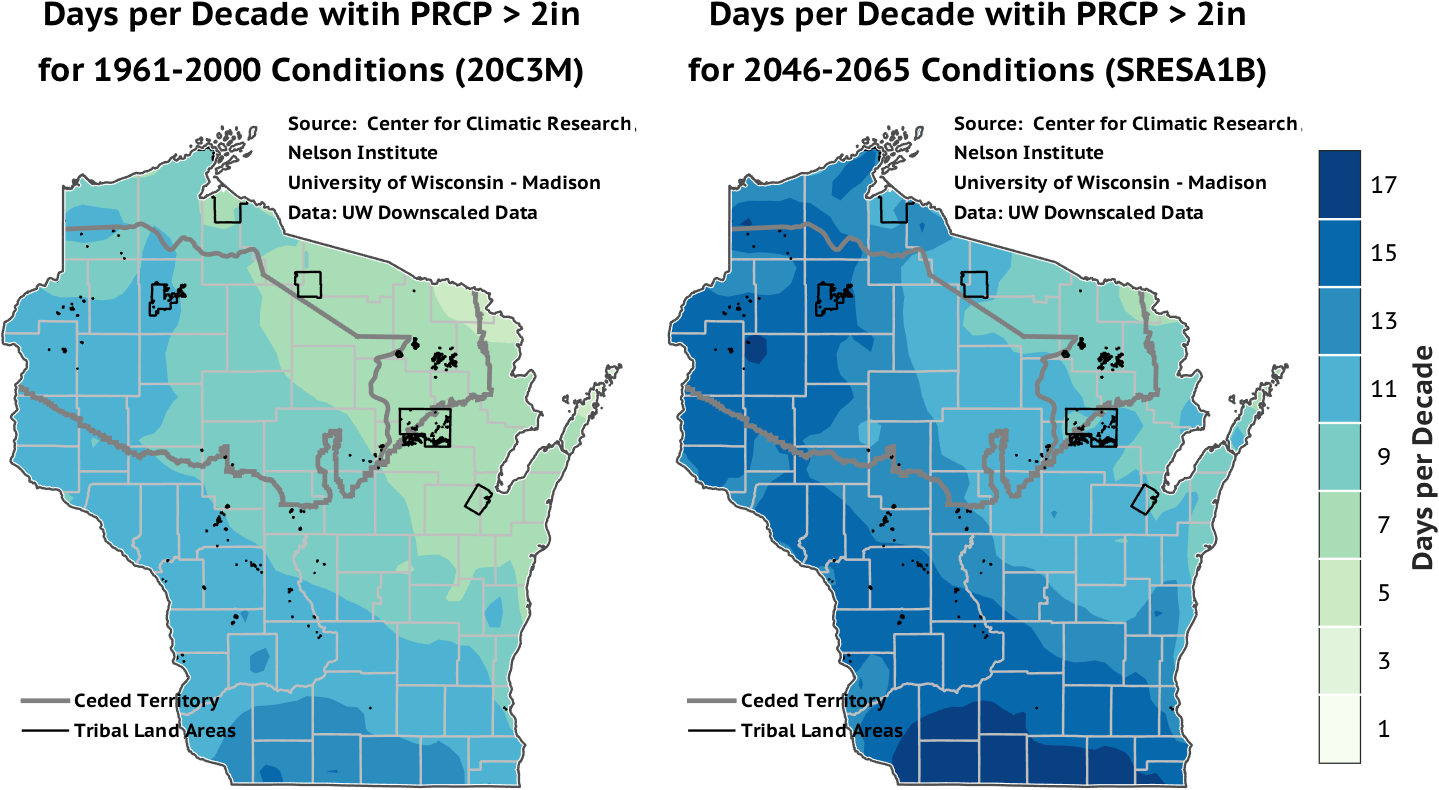
While our future precipitation patterns are more difficult to discern than temperature, the state is likely to continue its trend toward more precipitation overall (an increase of 0-15%) by mid-century, with the most probable increases in winter (5-25% increase) and spring (5-20% increase). It is not clear whether summer precipitation will increase or decrease (projections show between a 10% decrease to a 10% increase). Summer precipitation is strongly influenced by natural variations, so it is likely that some years will be wetter, some will be drier, and some will experience normal precipitation.
Despite uncertainty in future mean precipitation, models are somewhat consistent in predicting increases in extreme precipitation events (frequency and intensity), especially during winter and spring. These increases during Spring may correspond to rain on still-frozen ground, which can lead to problems with nutrient runoff and erosion from agricultural fields. Statewide warming also means an increase in rain events during winter, which coincides with reduced snow cover and shorter snow seasons.
WATER
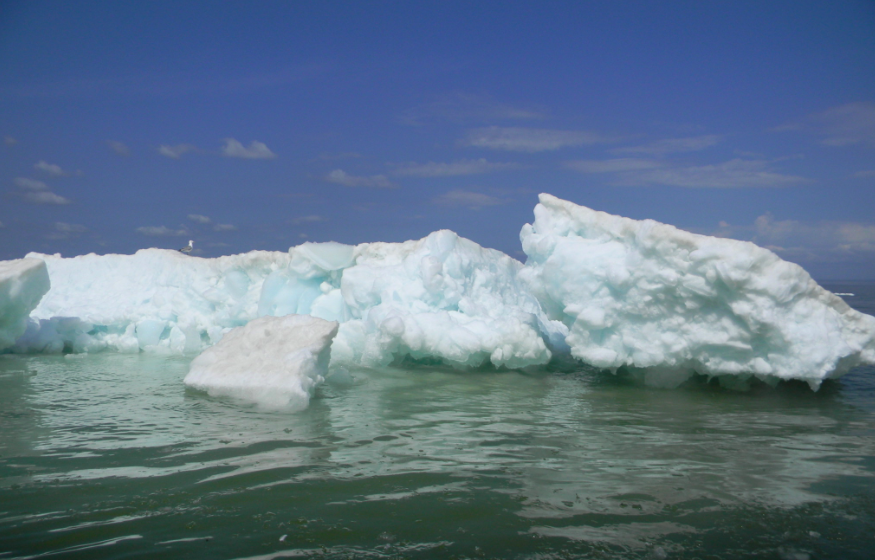
The quantity and quality of Wisconsin’s water resources are influenced by climate change. For example, we are seeing a decrease in the length of time that ice covers our lakes. Water levels fluctuate due to a variety of processes, including increased precipitation and prolonged drought, and due to changes in evapotranspiration (see Lake Superior and Lake Michigan lake levels). With evapotranspiration rates projected to increase in the future, water levels in northern lakes and wetlands could decline further during future periods of drought, such as the droughts that have occurred periodically during the past century.
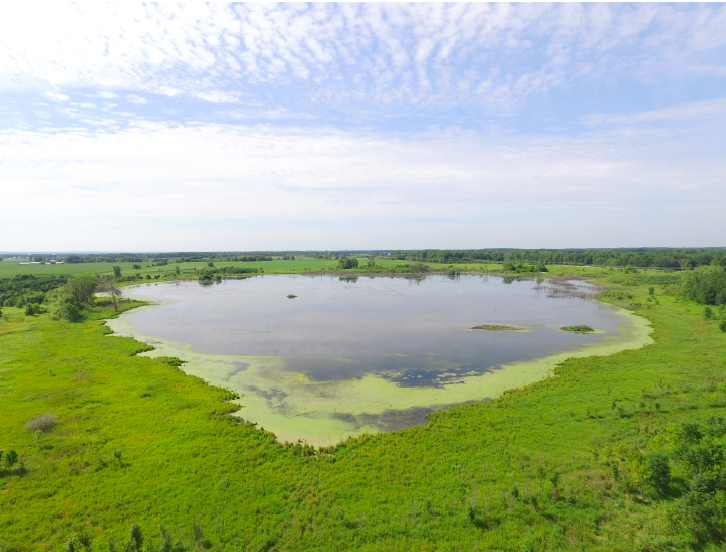
More runoff from projected heavy seasonal rainfalls will likely increase sediment and nutrient inputs to lakes and wetlands, leading to more blue-green algal blooms in lakes and loss of biodiversity in wetlands. Changes in the timing and amount of rainfall influence groundwater recharge, and any decrease in groundwater recharge could be compounded by increased demand for irrigation due to an extended growing season, shifts in the timing of precipitation, and high temperatures or regional droughts.
HABITATS
 Natural habitats respond to a changing climate in many ways, with impacts seen in wildlife, forests and plant communities. Plant hardiness zones are shifting; consequently, the ranges for many plant and animal species are expanding northward.
An earlier onset of spring may disrupt relationships between plants and pollinators and could cue reproduction or other lifecycle events at non-ideal times. Species currently found in northern Wisconsin at the southern edge of their range may no longer be able to survive in the state, while more southerly species, including those not currently present in the state, will expand northward.
Boreal tree species such as black spruce, balsam and paper birch may no longer grow in the state by the end of century, resulting in a dramatic change in the tree composition of our northern forests. Due to slow dispersal rates or fragmented habitat, migration of certain species to all these northern voids is not certain.
Rising stream temperatures, which result from rising air temperatures and other factors, will lead to changes in fish habitat. Projections show reduced habitat for native brook trout that require cold water, and a general transition toward warmer stream temperatures.
However, a warming climate will benefit other species, including the gray squirrel, white-tailed deer, European starling and Canada goose, with potential negative impacts on the environment resulting from increases in their populations.
AGRICULTURE
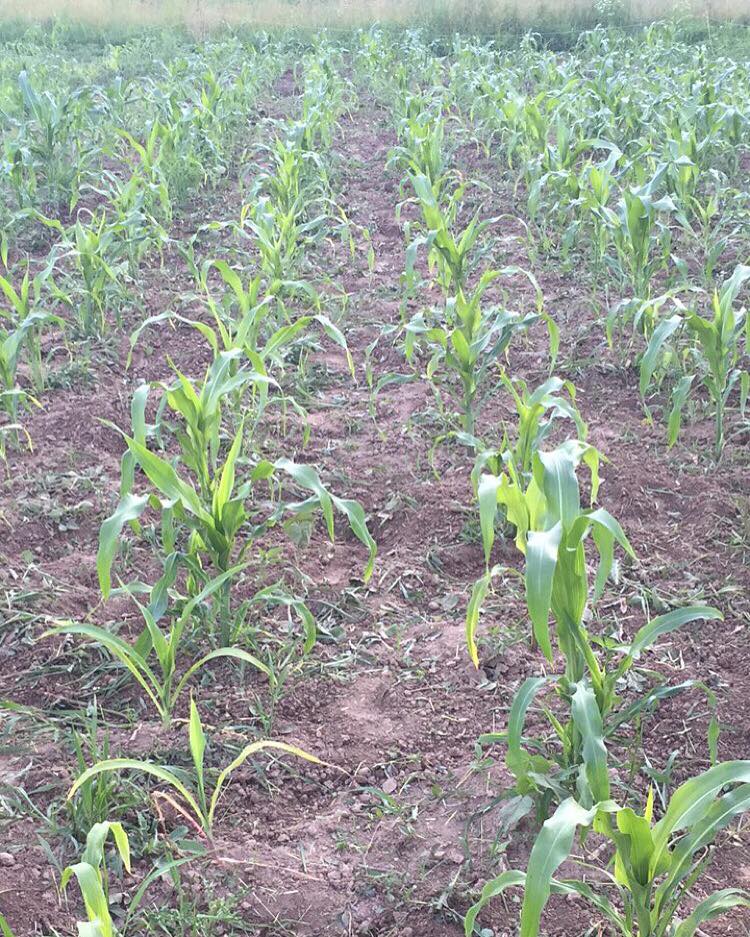
Wisconsin’s agriculture will also be affected by climate change. In general, research suggests that warming temperatures in spring and fall (see above) would help boost agricultural production by extending the growing season across the state. However, increased warming during the summer months could reduce yields of crops such as corn and soybeans, with studies suggesting that every 2° F of warming could decrease corn yields by 13 percent and soybean yields by 16 percent.
The projected precipitation trends of more annual rainfall and more intense storms (see above) heighten the potential for significant soil erosion. Most soil erosion occurs during the few heavy rainfall events that occur each season, and an increasing number of these storms are likely in our future. This is especially true during the spring months, when cultivated fields are mostly bare with little plant cover to reduce soil erosion.
Without appropriate adaptation measures, future precipitation patterns could double soil erosion rates by 2050 compared to 1990 rates. The good news is that Wisconsin farmers and natural resource managers have effective conservation practices at hand, and widespread implementation has the potential to counter the threat of soil loss from climate change.
COASTAL REGIONS
Wisconsin’s coastal regions face new challenges as reduced ice cover, and potential changes to lake levels and storminess over the Great Lakes could bring impacts including increased shoreline erosion and recession and an increase in the vulnerability of shoreline infrastructure. Coastal wetlands face increased sedimentation from runoff and flooding and greater threats from invasive species that take hold when an ecosystem is disrupted or warmed. Both high and low water levels will continue to impact coastal wetlands, bluffs and beaches due to natural fluctuations in water levels. Both high and low water levels will continue to impact coastal wetlands, bluffs and beaches due to natural fluctuations in water levels that occur every few decades.
ADAPTATION PRINCIPLES
As stakeholders determine which strategies will best achieve their goals, several adaptation principles may apply. These principles help identify which actions to implement first, the degree to which flexibility can be built into resource management practices, and whether some strategies will bring benefits regardless of how the climate continues to change. For example, they suggest that when vulnerability is high, it may be wiser to be safe rather than sorry. They remind us that variability in both time and space needs to be recognized; even within Wisconsin, changes and responses to impacts will differ across the state.
Many place-based impacts present unique restrictions and circumstances for adaptation. For example, large cities and tribal lands cannot be moved to more favorable climates, and designated natural areas may no longer protect the species they were originally designed to protect.
WEATHER VS CLIMATE
People often confuse weather with climate. These two words mean very different things. Knowing the difference can help us understand changes in climate that have already occurred and those that lie ahead.
Simply put, weather is the set of conditions happening at any time, or over relatively short periods such as days or weeks. We typically measure weather with instruments that record temperatures, humidity, rainfall, wind and other specific factors.
Climate is measured over much longer periods, most often on a scale of decades or more. Climate is the long-term average of weather conditions in a specific location. It is determined through statistical analyses of weather data collected over a long period of record.
An unusually heavy thunderstorm, a three-day snow event, three weeks of drought, an unusually hot summer or an unusually short winter are all examples of weather, which by themselves tell us little about climate. However, if those unusual conditions persist for long periods and cannot be explained by normal variability, it might indicate that a change in climate is taking place.
GLOBAL CLIMATE CHANGE
Wisconsin’s warming is in line with the amount of warming that our planet has experienced since the middle of the 20th century. The plot below shows how the global average temperature has varied over the last century and a half. While year-to-year fluctuations do exist, it is also clear that our planet’s temperature has been increasing, especially since about 1950.
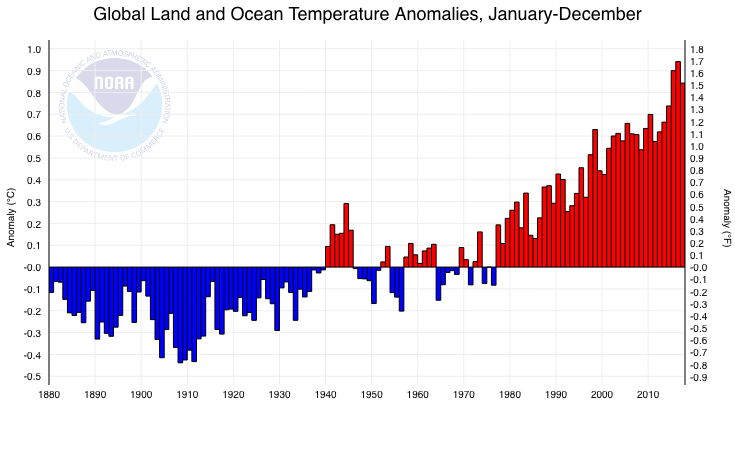
Global average temperature expressed as a change from the 20th century average. Red bars indicate years that were warmer than the 20th century average, and blue bars indicate years that were colder than the 20th century average. Data and image were obtained from: http://www.ncdc.noaa.gov/cag/global/time-series/.
What is responsible for the warming that we have experienced over the last century-and-a-half? Climate scientists are confident that the warming we have experienced is caused by human-induced increases in greenhouse gasses in our atmosphere, especially carbon dioxide. Carbon dioxide concentration in our atmosphere is steadily increasing due to human activity, most notably due to burning of fossil fuels and deforestation. The curve below shows the carbon dioxide concentration at Mauna Loa Observatory, in Hawaii. Like the temperature record above, it is clear that carbon dioxide concentrations in our atmosphere have been increasing.

Carbon dioxide (CO2) concentration at Mauna Loa Observatory. Each dot indicates a monthly-averaged value of carbon dioxide in parts per million volume. Data and image sources are documented at http://scripps.ucsd.edu/programs/keelingcurve/.
The plot above shows that carbon dioxide concentrations vary throughout the year, with two main features. The first is the yearly cycle in which carbon dioxide concentrations fall during late spring and summer as plants in the northern hemisphere take in atmospheric carbon dioxide during photosynthesis. From late boreal fall through spring, much of that carbon is released back to the atmosphere as plant matter dies and decays. The second feature is the long term increase in carbon dioxide. We know that this is due to human activity due to the isotopic signature of the increase, which is consistent with burning of fossil fuels and deforestation.
Although the future is not certain, we can be confident of a variety of expected changes. First, we can be confident that carbon dioxide levels will continue to increase in the next few decades. Further, we can expect that no one living on the planet today will ever observe carbon dioxide levels below 400 parts per million: we will not return to pre-2000 levels in the lifetime of anyone reading this website. Given the increase in carbon dioxide, we can confidently expect that our planet will continue to warm, even well after carbon dioxide concentrations stabilize at some new normal.
What can we do to reduce the risk that we face in a changing climate? Two actions are typically discussed: mitigation and adaptation. Mitigation involves actions to stabilize global carbon dioxide concentrations to reduce the inevitable amounts of global warming that we will experience. But even if our planet is successful at mitigating carbon dioxide concentrations, there is an inevitable amount of climate change that will occur. Our society needs to be preparing to adapt to that inevitable climate change. This set of online tools aims to equip individuals and organizations with the tools to develop adaptation strategies for their own communities.